A Complete Guide to Accounting for Manufacturing
Manufacturing accounting is the financial backbone of any business that creates its own products. It’s a specialized system for tracking every single penny that goes into the production process, from raw materials to the finished item sitting on the shelf. Unlike a retailer who just tracks the cost of buying and selling a finished product, a manufacturer has to meticulously follow the money as a pile of parts is transformed into something new.
Think of it as the financial recipe for your products—it tells you exactly what it costs to make something, which is the first step to figuring out if you're actually making a profit.
Decoding the Language of Manufacturing Accounting
Let's use a simple analogy: a bakery. A baker doesn't just track the price of the final cake. They have to know the cost of the flour, the sugar, the eggs, the baker's time, and even the gas for the oven. Manufacturing accounting works the same way. It gives you a clear financial story of your entire production journey.
This is what makes it so different from standard retail or service accounting. You're not just moving boxes; you're creating value from scratch, and every step in that creation process has a cost that needs to be captured.
To do this, we break down all production expenses into three main categories. Getting a handle on these is the first real step to mastering your manufacturing finances.
The Three Core Cost Ingredients
Just like a cake recipe has its essential ingredients, every product you make has three fundamental cost components you need to track:
- Direct Materials: These are the raw goods that physically become part of your final product. If you're building a wooden chair, this is the lumber, screws, and stain. For a t-shirt, it’s the cotton fabric and thread. These are the tangible costs you can easily trace back to a single unit.
- Direct Labor: This is what you pay the people who are hands-on in the production process. It’s the wages for the machine operators, the assembly line workers, and the technicians who are physically turning raw materials into finished goods.
- Manufacturing Overhead: This is the big "catch-all" bucket for all the other factory costs. These are expenses that are essential for production but aren't tied to one specific item. Think of it as the cost of keeping the lights on in the factory—the rent, utility bills, equipment depreciation, and salaries for supervisors or maintenance staff.
When you add these three up, you get your total manufacturing cost. And believe me, getting this number right isn't just a bean-counting exercise; it's a strategic imperative.
By meticulously tracking direct materials, direct labor, and overhead, you gain precise control over your production costs. This control directly impacts your pricing, your profit margins, and the overall financial health of your business. Without it, you’re flying blind.
Ultimately, mastering manufacturing accounting lets you answer the most critical questions with confidence. How much does it truly cost to make one unit? Which of my products are actually making me money? Where can I cut waste and become more efficient? This financial visibility is the foundation you need to build a scalable, profitable manufacturing operation.
The Core Pillars: Cost of Goods Manufactured and Sold
To get a real handle on manufacturing accounting, you have to follow the money as a product comes to life. It’s not a single event but a journey through different stages, and each stage has its own inventory account. Think of it like baking cookies: you start with raw ingredients (flour, sugar), move to the mixing and baking phase, and finally, you have a tray of finished cookies ready to be sold.
This transformation from raw potential into a sellable product is the heart of manufacturing finance. Every stage represents a distinct type of inventory on your balance sheet. Tracking how costs move from one stage to the next is absolutely fundamental—it’s how you nail down your true production costs and, ultimately, your profitability.
The whole process is a flow of costs, where materials, labor, and overhead are poured into production.
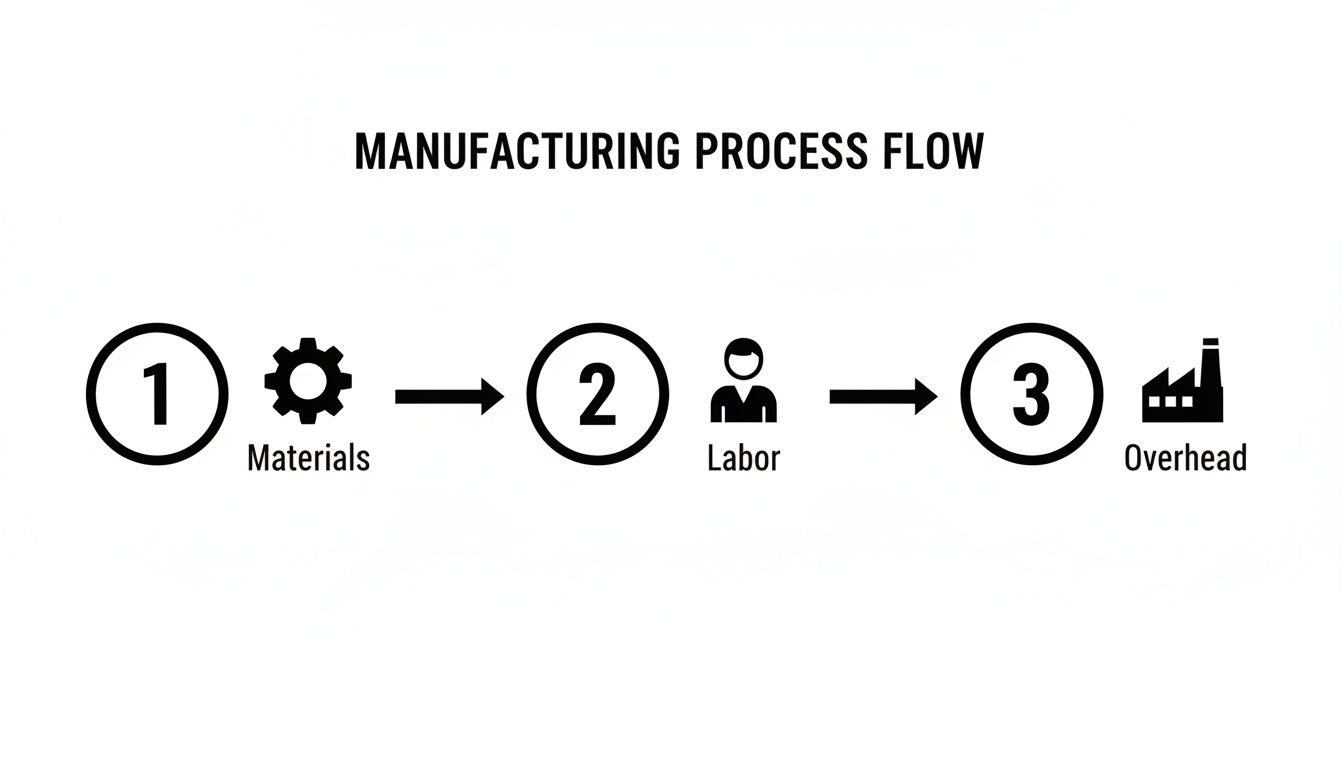
As you can see, direct materials, direct labor, and manufacturing overhead are the three core inputs that combine to create value.
From Half-Baked to Ready-to-Sell
The first two key inventory stages we need to talk about are Work-in-Process (WIP) and Finished Goods. These accounts capture the value of your products while they're being made and after they're complete.
- Work-in-Process (WIP) Inventory: This is your "mixing and baking" stage. It includes everything on the factory floor that's partially built. The value of your WIP inventory is the sum of all direct materials, direct labor, and manufacturing overhead that have already gone into these unfinished units.
- Finished Goods Inventory: These are the fully baked cookies, ready for customers. This account holds the total cost of all products that have made it through the entire production line and are now just waiting to be sold. The value here is essentially the final Cost of Goods Manufactured (COGM) for those specific units.
The flow is logical: costs are added to the WIP inventory as production moves along. Once a product is complete, its total cost gets transferred out of the WIP account and into the Finished Goods account.
Calculating the Cost of Goods Manufactured (COGM)
The Cost of Goods Manufactured (COGM) is a vital calculation. It tells you the total cost of all the products that were actually completed during a specific period. It's not just your total manufacturing spending for the month; it cleverly accounts for items that were started but not yet finished.
COGM is the bridge between your production spending and your final inventory. It answers the question: "What was the total manufacturing cost of the items we finished this month?"
The formula ties your core costs together with the changes in your in-progress inventory:
Total Manufacturing Costs + Beginning WIP Inventory - Ending WIP Inventory = COGM
This calculation makes sure you're only counting the costs associated with completed goods, which is why it's such a pivotal number for accurate financial reporting.
Connecting Production to Profit with COGS
Finally, we get to the Cost of Goods Sold (COGS). This is the big one that shows up on your income statement and directly impacts your gross profit. It represents the total production cost of only the items you sold during the period.
To calculate COGS, you need to know your COGM and track how your inventory of finished goods has changed. The following table breaks down how COGM and COGS are calculated and how they are connected through your inventory balances.
Calculating COGM and COGS Step-by-Step
| Formula Component | Description | Example Value |
|---|---|---|
| Beginning WIP Inventory | The value of partially completed goods at the start of the period. | $10,000 |
| + Total Manufacturing Costs | The sum of direct materials, direct labor, and overhead added during the period. | $100,000 |
| - Ending WIP Inventory | The value of partially completed goods remaining at the end of the period. | $15,000 |
| = Cost of Goods Manufactured (COGM) | The total cost of goods completed during the period. | $95,000 |
| Beginning Finished Goods Inventory | The value of completed goods ready for sale at the start of the period. | $20,000 |
| + Cost of Goods Manufactured (COGM) | The value of newly completed goods transferred from WIP. | $95,000 |
| - Ending Finished Goods Inventory | The value of unsold completed goods remaining at the end of the period. | $25,000 |
| = Cost of Goods Sold (COGS) | The total cost of the specific inventory items that were sold. | $90,000 |
This final calculation ties everything together, tracing the flow of costs from a pile of raw materials all the way to an expense on your income statement. Mastering these formulas is non-negotiable for any manufacturing business. In fact, the global accounting services industry, which is deeply tied to manufacturing, is projected to reach $643.8 billion in revenue by 2025, partly because expertise in these exact calculations is in such high demand. You can read more about the growth of global accounting services to see just how vital this function has become.
Choosing Your Costing Method: Job vs. Process Costing
Alright, you understand how costs move through the production cycle. Now for the big question: how do you actually attach those costs to the things you make? This isn't a one-size-fits-all situation.
Manufacturing accounting gives us two main systems for this, each built for a totally different way of making things: job order costing and process costing. Think of it like a restaurant. You wouldn't use the same cost-tracking method for a one-of-a-kind wedding cake that you would for a thousand identical bagels baked every morning.
Getting this choice right is foundational. It’s what makes your product costs accurate, your pricing smart, and your profit analysis trustworthy. If you pick the wrong system, you could end up with skewed numbers that lead you to push the wrong products or drop a hidden gem.
When to Use Job Order Costing
Job order costing is tailor-made for businesses that produce unique, custom, or distinct items. Every product or small batch is its own "job," and you meticulously track every dollar of direct material, every minute of direct labor, and a fair share of overhead specifically to that job.
Picture a shop that builds custom trailers. Each one is a unique project with different steel, axles, and labor hours. The whole point of job costing is to figure out precisely what it cost to build that specific trailer.
This is the clear choice for industries like:
- Custom Manufacturing: Think bespoke machinery, tailored suits, or architectural models.
- Construction: Every building project is a distinct job with its own budget and costs.
- Service Industries: Ad agencies, repair shops, and consulting firms often track costs by client project, which is just another name for a "job."
The keyword here is precision. Job costing gives you a laser-focused view of profitability for each individual item, which is absolutely critical when no two products are the same.
When to Use Process Costing
On the other side of the coin, we have process costing. This is built for the world of mass production, where thousands of identical units flow down a line through a series of standardized steps or "processes."
Instead of tracking the cost of a single item—which would be impossible—you track the total cost of running a process for a period and then average it out over all the units that went through.
A classic example is a paint manufacturer. It would be an exercise in futility to try and calculate the cost of pigment in one specific can of paint. Instead, the company totals up all the costs for the mixing department for the month and divides that by the thousands of gallons of paint produced.
This approach is the perfect fit for:
- Food and Beverage: Think cereal, canned goods, or soft drinks.
- Chemicals and Pharmaceuticals: Products like gasoline or aspirin are made in huge, uniform batches.
- Basic Materials: Industries churning out cement, steel, or paper live and die by process costing.
Here, the focus is on averages and efficiency. You need to know the average cost per unit to manage a high-volume operation effectively.
The decision between job and process costing isn't just a preference—it's dictated by your production reality. Choosing the system that mirrors how you actually make your products is the only way to generate financial data you can truly trust.
Job Costing vs. Process Costing at a Glance
To make this crystal clear, here’s a head-to-head comparison. This table should help you quickly see where your operation fits.
| Feature | Job Order Costing | Process Costing |
|---|---|---|
| Product Type | Unique, custom, or distinct items (heterogeneous) | Identical, uniform products (homogeneous) |
| Production Volume | Low volume, often single units or small batches | High volume, continuous production |
| Cost Accumulation | By individual job or project | By department or production process |
| Key Document | Job Cost Sheet | Departmental Production Report |
| Unit Cost Calculation | Total cost of a job / number of units in that job | Total process costs / number of units from that process |
| Real-World Examples | Custom furniture, construction, ad campaigns | Soda bottling, oil refining, cereal manufacturing |
Ultimately, your production line tells you which method to use. If you see distinct projects starting and stopping, you're in the job costing world. If you see a continuous flow of identical items, process costing is your answer.
A Note on Standard Costing
Whether you choose job or process costing, many savvy manufacturers add another layer: standard costing. This isn't a third system but rather a control tool you can use with either one.
Here’s the idea: you establish a predetermined or "standard" cost for your materials, labor, and overhead before production begins. Then, as you incur actual costs, you compare them to these standards. Any difference is called a variance, and it's a huge red flag telling you something is off.
This is an incredibly powerful way to keep a lid on expenses. With global manufacturing output expected to hit $46.7 trillion by 2025, even small inefficiencies can add up to huge losses. In a world of trade uncertainties and volatile material prices, standard costing helps you immediately spot where you’re bleeding money so you can fix it. You can read more about the challenges and growth in global manufacturing to see why these controls are more important than ever.
Mastering Manufacturing Overhead and Inventory Valuation
So far, we’ve talked about the straightforward costs—the ones you can easily point to, like a pile of raw materials or the wages for your assembly team. But what about all the other expenses that keep your factory humming? This is where we get into two of the trickiest, yet most critical, parts of manufacturing accounting: handling overhead and figuring out what your inventory is actually worth.
Think of manufacturing overhead as all the costs that are absolutely essential for production but aren't tied to a single, specific item. It’s the factory rent, the supervisor’s paycheck, the electricity powering the machines, and even the cleaning supplies for the shop floor. You can't build your product without them, but you also can't say exactly how many cents of electricity went into making one wooden chair. That’s why we have to allocate it.
How to Allocate Manufacturing Overhead
Since you can't trace these indirect costs, you need a logical system to spread them across all the products you make. The go-to method for this is using a predetermined overhead rate. It sounds complicated, but it's really just a two-step process you set up at the beginning of the year.
- Estimate Your Total Overhead: First, you look ahead and forecast all your factory overhead costs for the upcoming year. Tally up everything—rent, utilities, indirect labor, equipment depreciation, you name it. Let's say you estimate your total overhead will hit $200,000.
- Choose an Allocation Base: Next, you need a driver, an activity that these overhead costs are closely related to. This "allocation base" should be something you can easily track, like direct labor hours or machine hours. If your shop is filled with automated equipment, machine hours are a perfect fit. Let's assume you project your factory will run for 10,000 machine hours this year.
Now, you just do the simple math to find your rate:
Predetermined Overhead Rate = Estimated Total Overhead Costs / Estimated Allocation Base
For our example, that’s $200,000 / 10,000 machine hours, which gives us a rate of $20 per machine hour. This means for every single hour a machine is running to make a product, you’ll "apply" $20 of overhead to that product's cost. This systematic approach ensures every item shoulders its fair share of the factory’s background expenses.
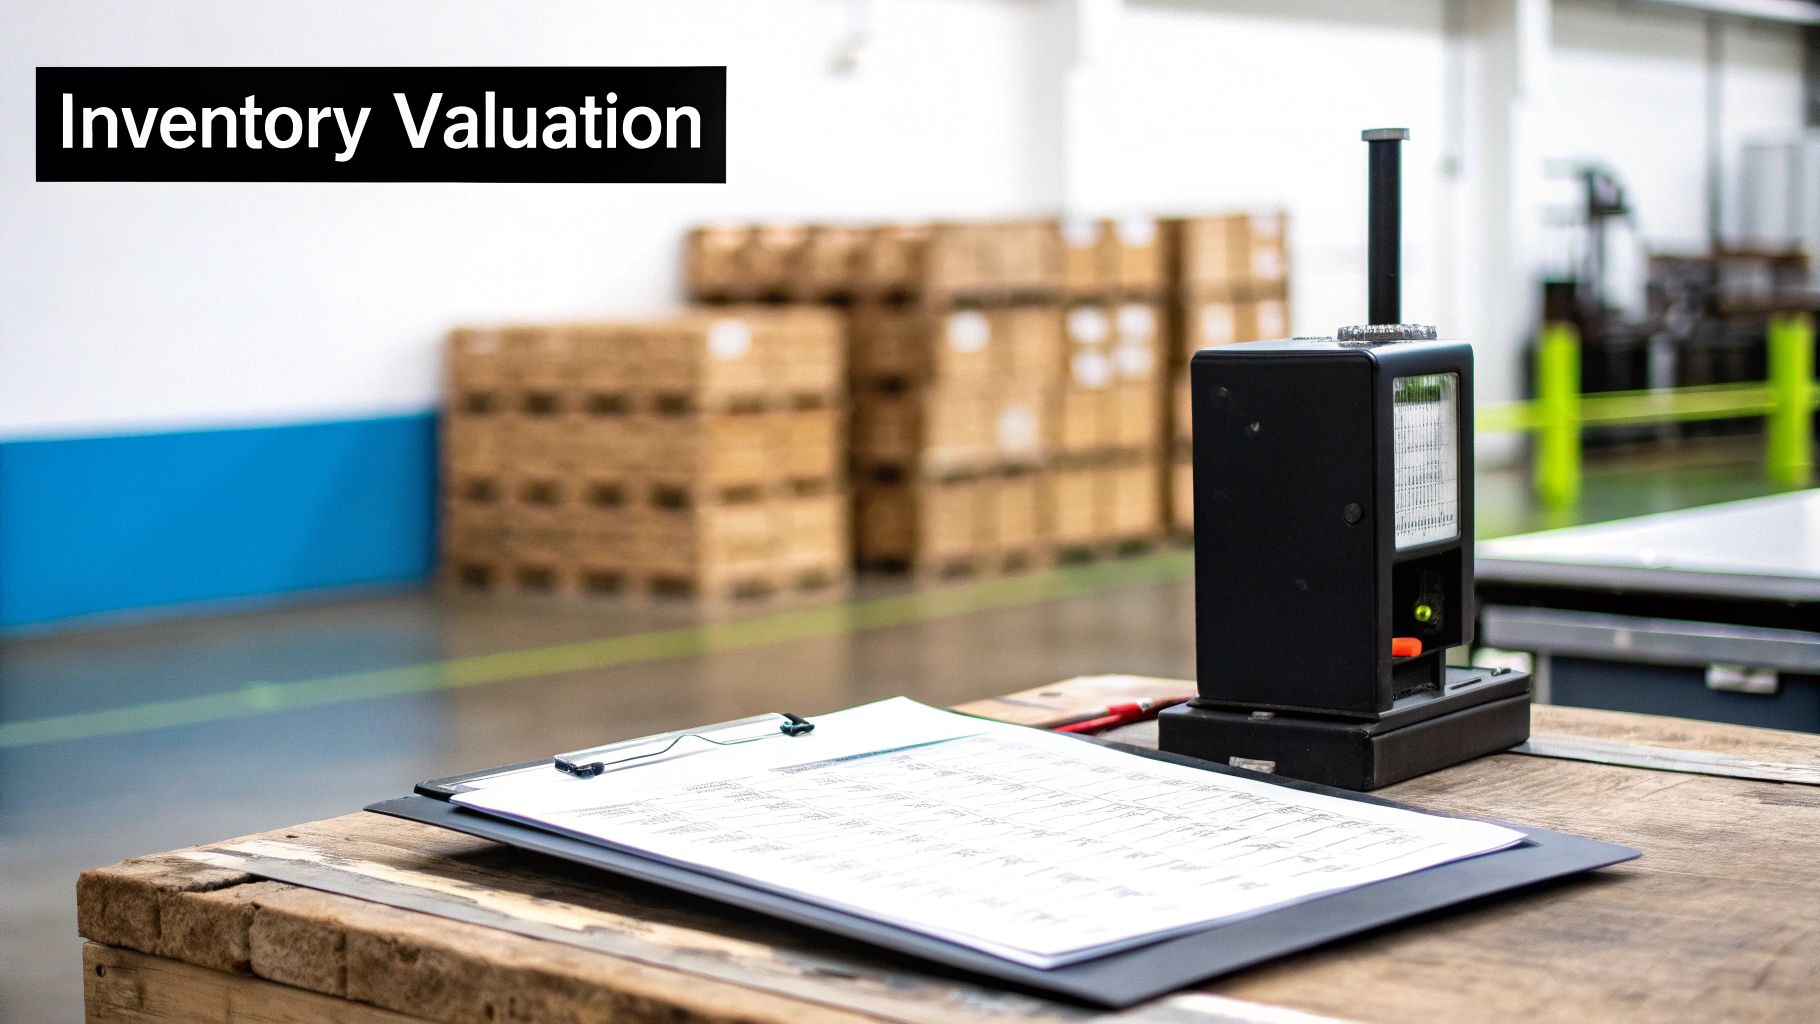
Choosing Your Inventory Valuation Method
Once your products are finished and sitting on the shelf, another big accounting decision is waiting for you: how do you assign a value to them? The price of your raw materials almost never stays the same. The steel you bought in January was likely cheaper than the steel you bought in June. This is exactly why inventory valuation methods exist.
The method you choose has a direct ripple effect on both your Cost of Goods Sold (COGS) on the income statement and the value of ending inventory on your balance sheet. There are three main ways to do it.
- First-In, First-Out (FIFO): This common-sense method assumes the first items you bought are the first ones you sell. Think of a grocery store pushing the oldest milk cartons to the front of the shelf. When prices are rising, FIFO gives you a lower COGS and, as a result, higher reported profits.
- Last-In, First-Out (LIFO): LIFO works in the exact opposite way. It assumes the newest items you purchased are the first ones to go out the door. Imagine a pile of sand where you always scoop from the top layer. In an inflationary environment, LIFO results in a higher COGS, which leads to lower reported profits and, often, a smaller tax bill.
- Weighted-Average Cost: This method smooths everything out. You simply calculate the average cost of all the goods you have on hand and apply that single average cost to each unit sold. It’s a nice middle-of-the-road approach that avoids the dramatic swings of FIFO and LIFO.
The choice between FIFO, LIFO, and Weighted-Average is more than an accounting detail—it's a strategic decision. It affects your reported profitability, your tax obligations, and how investors perceive your company's financial health, especially in volatile economic climates.
Let's see it in action. Say a company buys 100 units at $10 each and then buys 100 more at $12 each. Now, they sell 150 units.
- Under FIFO: The COGS would be calculated using the first 100 at $10 and then 50 of the next batch at $12. The total COGS would be $1,600.
- Under LIFO: The COGS would use the last 100 at $12 and then 50 from the first batch at $10. This gives you a total COGS of $1,700.
That $100 difference flows straight to your bottom line. Choosing the right method requires a solid grasp of your cost trends and what you want your financial statements to communicate.
Essential Journal Entries for Manufacturing
Knowing the concepts behind accounting for manufacturing is great, but seeing how the numbers actually move from one account to another is where it all finally clicks. Think of journal entries as the language of accounting; they tell the financial story of your production process one transaction at a time.
This is where the theory becomes practice. Let's walk through the core journal entries that form the foundation of any manufacturing business. Each entry marks a specific step in the journey, from buying raw materials all the way to shipping the final product. Following the flow makes the whole process tangible and much easier to grasp.
Recording Material Purchases and Usage
Every production cycle kicks off with raw materials. When you buy these materials, you're not spending money in the typical sense—you're converting one asset (cash) into another (inventory).
Example 1: Purchasing Raw Materials Let's imagine a custom furniture maker, "Artisan Tables," buys $10,000 worth of premium oak lumber on credit. The journal entry shows an increase in the Raw Materials Inventory (an asset) and a corresponding increase in Accounts Payable (a liability).
| Account | Debit | Credit |
|---|---|---|
| Raw Materials Inventory | $10,000 | |
| Accounts Payable | $10,000 | |
| To record purchase of oak lumber |
Next, those materials have to move from the storeroom onto the factory floor to be turned into something. This is a critical step where we separate the direct materials (the oak that becomes the table) from the indirect materials (like sandpaper, glue, or screws).
Example 2: Issuing Materials to Production Artisan Tables requisitions $8,000 of oak for a specific dining table order and $500 of glue and sandpaper. The oak is a direct cost, so it gets debited to the Work-in-Process (WIP) Inventory. The glue and sandpaper are indirect, so they get added to the Manufacturing Overhead cost pool.
| Account | Debit | Credit |
|---|---|---|
| Work-in-Process Inventory | $8,000 | |
| Manufacturing Overhead | $500 | |
| Raw Materials Inventory | $8,500 | |
| To record issuance of materials |
Capturing Labor and Overhead Costs
Just like materials, labor costs need to be recorded and assigned correctly. We draw a clear line between the wages of people physically building the product and those who support the factory's operations.
Example 3: Recording Labor Costs During the pay period, Artisan Tables pays $4,000 in wages to its woodworkers (direct labor) and $1,500 to the factory supervisor (indirect labor). The woodworkers' wages go straight into WIP, while the supervisor's salary is another component of Manufacturing Overhead.
| Account | Debit | Credit |
|---|---|---|
| Work-in-Process Inventory | $4,000 | |
| Manufacturing Overhead | $1,500 | |
| Wages Payable | $5,500 | |
| To record factory labor costs |
Now, we need to apply all those indirect overhead costs to the job using our predetermined rate. This ensures every product absorbs its fair share of the factory's background expenses.
Key Insight: Applying overhead isn't about recording new spending; it's an allocation. This step is what allows you to calculate a product's full cost before it's finished, which is vital for setting prices and keeping costs in check.
Example 4: Applying Manufacturing Overhead Let's say Artisan Tables applies overhead at a rate of $20 per direct labor hour. The dining table job took 100 hours of direct labor to complete. The applied overhead is therefore $2,000 ($20 x 100 hours). We move this amount from the general Manufacturing Overhead account into the specific job's WIP Inventory.
| Account | Debit | Credit |
|---|---|---|
| Work-in-Process Inventory | $2,000 | |
| Manufacturing Overhead | $2,000 | |
| To apply overhead to production |
Completing and Selling the Product
With production wrapped up, the product's total accumulated cost is transferred from the factory floor (WIP) to the warehouse shelves (Finished Goods).
Example 5: Transferring Completed Goods The dining table is finished! Its total cost is the sum of its parts: direct materials ($8,000), direct labor ($4,000), and applied overhead ($2,000). The total cost of $14,000 is moved from WIP Inventory to Finished Goods Inventory.
| Account | Debit | Credit |
|---|---|---|
| Finished Goods Inventory | $14,000 | |
| Work-in-Process Inventory | $14,000 | |
| To record completion of job |
And finally, the moment we've been working toward: the sale. This always requires two separate but related journal entries. The first records the revenue, and the second recognizes the cost of the item you just sold (COGS).
Example 6: Recording the Sale and Cost of Goods Sold Artisan Tables sells the dining table for $25,000 on account. First, we book the sale itself:
| Account | Debit | Credit |
|---|---|---|
| Accounts Receivable | $25,000 | |
| Sales Revenue | $25,000 | |
| To record sale of dining table |
At the exact same time, we have to record the expense. The table is no longer our asset; its cost now becomes the Cost of Goods Sold.
| Account | Debit | Credit |
|---|---|---|
| Cost of Goods Sold | $14,000 | |
| Finished Goods Inventory | $14,000 | |
| To record cost of sale |
By following this logical sequence, you create an airtight financial trail for every single product that moves through your business.
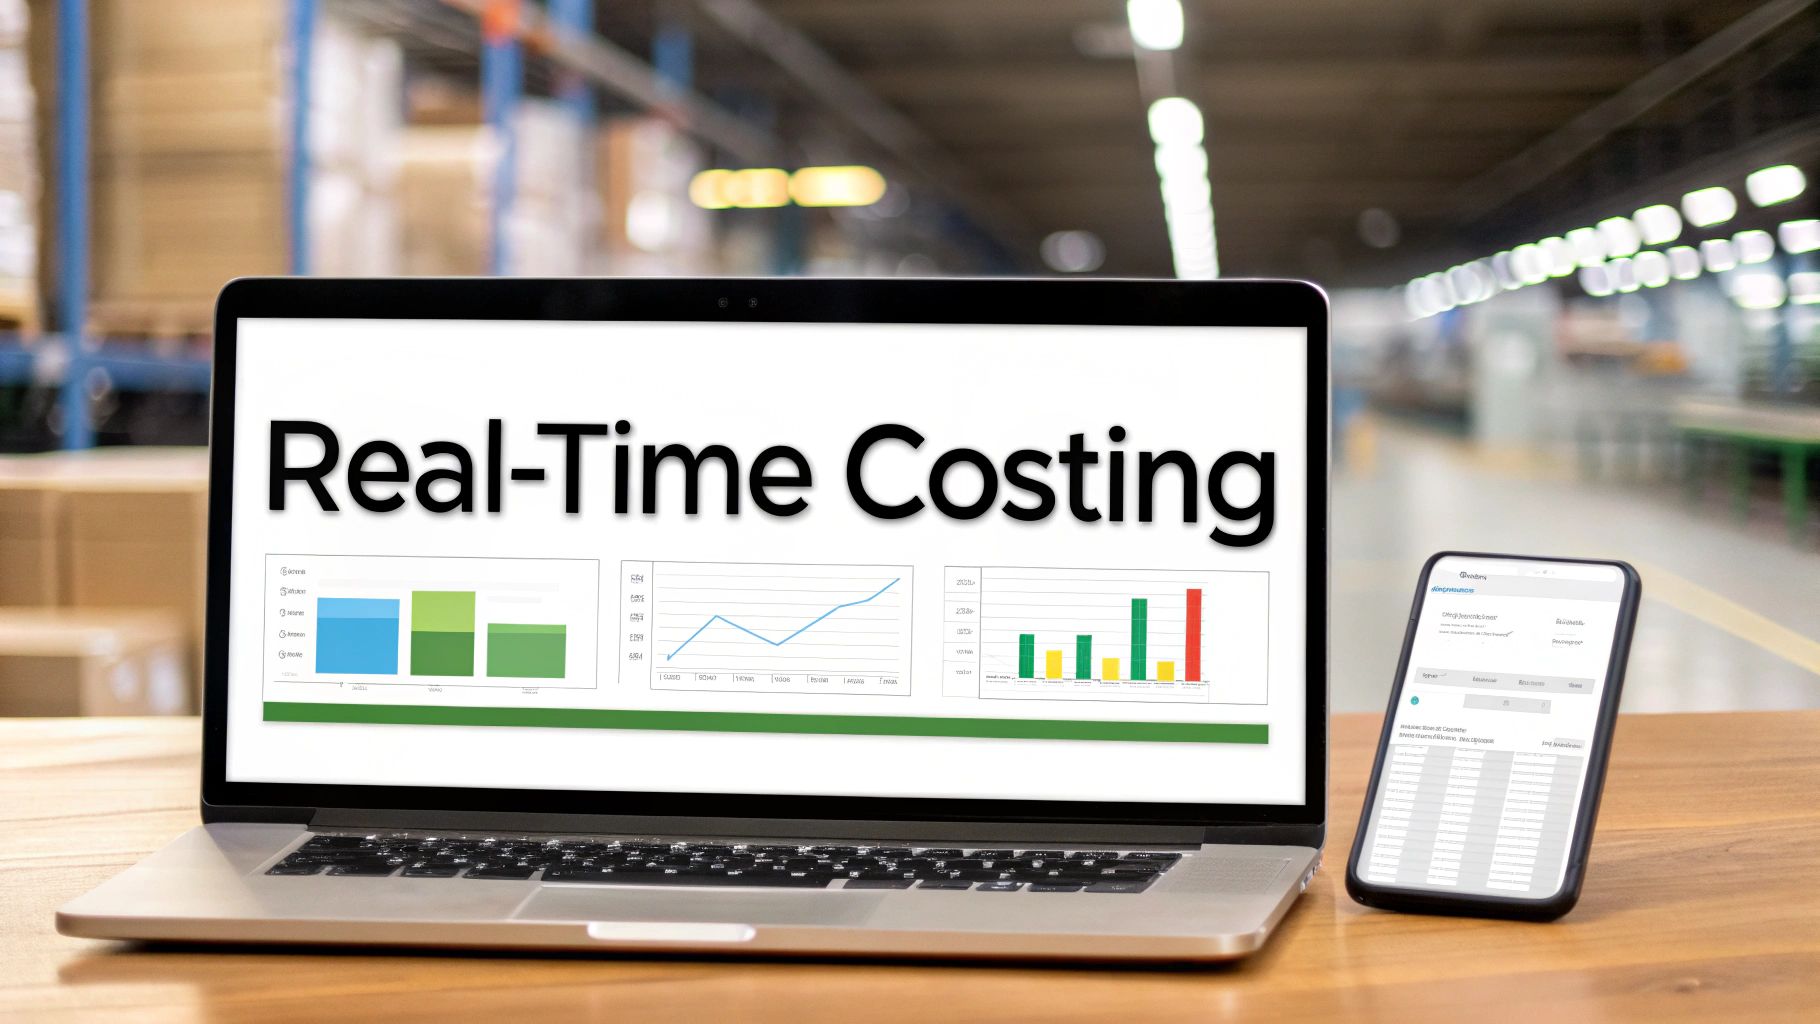
Leveraging Technology for Modern Manufacturing Accounting
If you're still wrestling with manual ledgers and disconnected spreadsheets, you're playing on hard mode. The days of treating manufacturing accounting as a backward-looking bookkeeping task are long gone. To stay competitive, you need technology that turns your accounting function into a forward-looking, strategic part of the business. The right tools do more than just crunch numbers faster—they give you the real-time visibility needed to make sharp, profitable decisions on the fly.
This whole shift hinges on integrated software, most often an Enterprise Resource Planning (ERP) system. Think of an ERP as the central nervous system of your entire manufacturing operation. It links your accounting team to every other part of the business, from the moment raw materials hit the receiving dock to the final sale. Instead of someone manually keying in data from different departments, the information flows automatically.
The Power of Integrated ERP Systems
Remember all those journal entries we walked through? An ERP is built to automate them. When raw materials are delivered, the system updates inventory and accounts payable instantly. As a product moves down the line, the ERP tallies its cost and, once complete, seamlessly shifts its value from WIP to Finished Goods. No manual intervention needed.
This level of integration brings some serious advantages:
- Real-Time Inventory Tracking: You always know precisely what's on hand, what's currently being made, and what’s ready to go. This drastically cuts down on both stockouts and costly over-ordering.
- Automated Costing: The system does the heavy lifting, applying direct materials, labor, and overhead to jobs as they progress, ensuring your costs are consistently accurate.
- Simplified Overhead Allocation: Those tricky overhead calculations based on machine hours or labor? The system handles them automatically, virtually eliminating the risk of human error.
- Streamlined Reporting: Need an up-to-the-minute income statement or balance sheet? It’s just a click away.
An integrated ERP system breaks down the walls between departments. It frees your accounting team from being data-entry clerks and empowers them to become strategic analysts who can actually interpret the numbers, not just chase them down.
Smart Manufacturing and the Data Revolution
The next evolution is already here: smart manufacturing and the Internet of Things (IoT). By placing sensors on machinery and across the factory floor, companies can now pull in incredibly granular, real-time data about every step of the production process. This firehose of data feeds directly into modern accounting and ERP systems, unlocking a whole new level of precision.
For example, IoT sensors can track the exact runtime for a specific job, giving you hyper-accurate overhead allocation. They can also monitor a machine's health, flagging potential issues so you can schedule maintenance before a costly breakdown brings production to a halt.
This isn't some far-off trend; it’s happening now. The smart manufacturing market is on track to hit $589 billion by 2028, with 70% of manufacturers already planning to adopt IoT for real-time monitoring. This integration can even slash logistics lead times by up to 20%. You can discover more insights about these manufacturing statistics to see just how profoundly technology is reshaping the industry.
When you're evaluating systems, make sure to find one that fits the unique quirks of your business. Can it handle your complex bill of materials (BOMs)? Does it support your inventory valuation method (FIFO, LIFO, etc.)? Can it plug into your e-commerce platforms? By marrying solid accounting principles with modern tools, you build a financial foundation that’s strong enough to support real growth and profitability.
Your Top Manufacturing Accounting Questions, Answered
Even when you feel like you've got a handle on the basics, real-world situations always bring up new questions. Let's tackle some of the most common ones that pop up when you're in the thick of it.
How Often Should I Be Calculating COGM?
For tax purposes, you might only need to calculate the Cost of Goods Manufactured (COGM) once a year. But if you're serious about running an efficient operation, you should be doing it at least monthly.
Running the numbers every month gives you a much sharper, up-to-date view of how your production line is performing. It lets you catch rising costs or other negative trends early, so you can make changes before they blow a hole in your profit margins.
What’s the Real Difference Between Product and Period Costs?
Getting this right is fundamental to manufacturing accounting. It’s one of those things you just have to know.
Product Costs are every penny you spend to create your physical product. We're talking direct materials, the wages of your assembly team (direct labor), and all the factory overhead. These costs stick to the inventory and only hit your income statement as COGS when you actually sell the item.
Period Costs are everything else—the costs of running the business outside the factory floor. This is your SG&A (Selling, General & Administrative) bucket: marketing team salaries, rent for the front office, sales commissions, you name it. These get expensed in the month they happen, no matter how much you sold.
Here's a simple way to think about it: product costs are "factory" costs, while period costs are "office" costs. Keeping that line clear is non-negotiable for accurate inventory valuation and figuring out if you're actually making money on what you sell.
Can I Mix and Match Inventory Valuation Methods?
I get this question a lot, and the short answer is no. For the sake of consistency in your financial reporting, you need to stick with one method (FIFO, LIFO, or Weighted-Average) for all similar inventory items.
Flipping between methods would make your financial results look skewed and unreliable from one period to the next. That’s why accounting rules demand consistency. If you ever have a legitimate reason to change, you have to formally justify it and disclose the impact in your financial statements.
Ready to stop guessing and start knowing your true costs and profits? HiveHQ provides an all-in-one suite with a powerful Profit Dashboard that makes sense of your COGS, ad spend, and commissions, giving you the clarity needed to scale. Automate your operations and make data-led decisions by exploring our tools at https://hivehq.ai.